Argor-Heraeus
Established in 1951 and located in Mendrisio, Switzerland, Argor-Heraeus is a long-standing refinery. Specialized in the refining and processing of gold, silver, platinum and palladium, we are a global leader in the precious metals industry. With our unique blend of Swiss precision and innovative craftsmanship, we are a trusted and responsible partner for comprehensive precious metal solutions throughout the entire value chain.
Committed to responsibility
As a leading precious metals refining and manufacturing company, Argor-Heraeus is uniquely positioned to identify improvement potentials and unlock opportunities—advancing one of the sector’s most ambitious goals: building a truly responsible precious metals industry.
We apply stringent compliance checks and responsible sourcing practices across the entire value chain from the point of origin to the final product.

Connecting the whole supply chain
With its comprehensive range of products and services, a world-renowned reputation for responsibility and excellence, and a scalable and flexible production capacity, Argor-Heraeus is one of the leading company in the world of precious metals.
From sourcing to the end user, all along the entire precious metal supply chain, Argor-Heraeus is the responsible and reliable partner for every precious metal solution, working with a wide variety of trusted customers and partners in more than 50 countries.
.png)
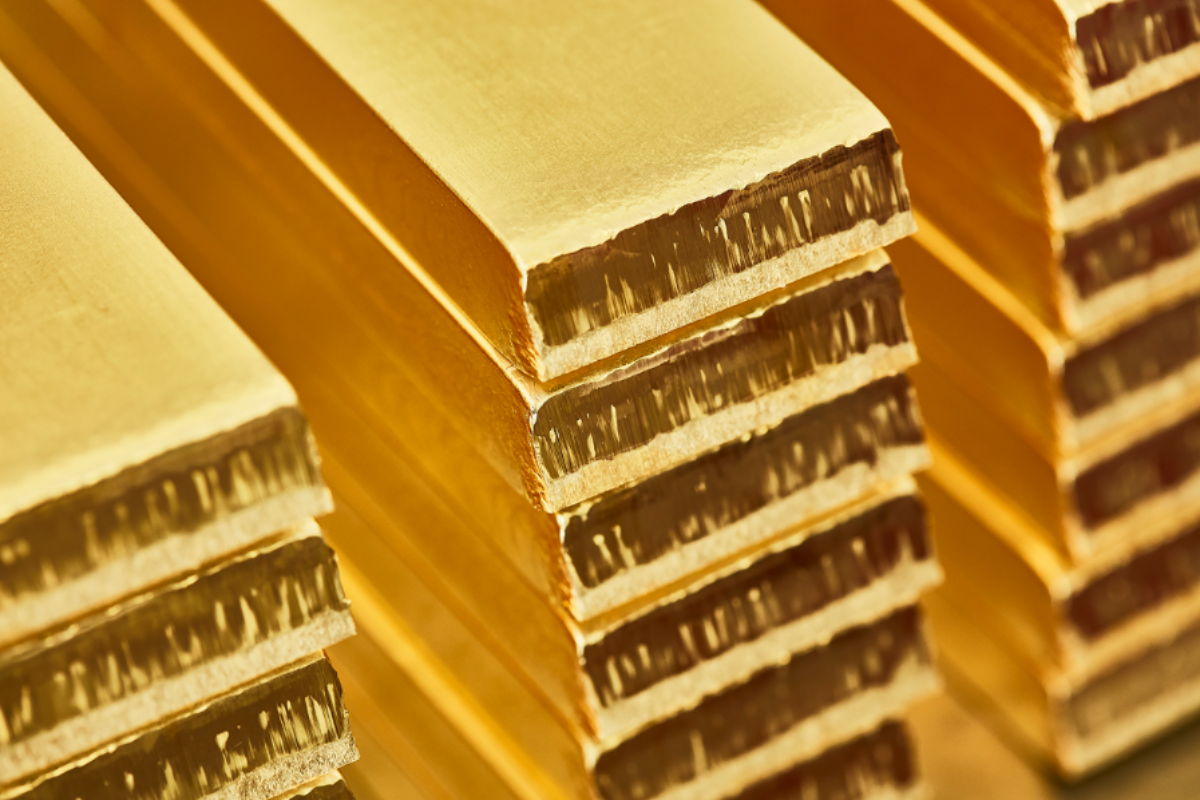
Products & Services


.jpg)
Quality referee for the precious metals sector
Argor-Heraeus is proud to be one of only seven global referees appointed by the LBMA, a role we've held since the referee system was introduced in 2003. The LBMA referees are appointed to help uphold the integrity of the LBMA Good Delivery List—the internationally recognized benchmark for quality and trust in precious metals.
.png)
.png)

.png)
